


Every year, millions of Indians park their savings in Fixed Deposits — trusting the bank, accepting … Debt Mutual Fund Complete Guide: Types, Returns, Risks, Tax — Everything in One PlaceRead more


Every year, millions of Indians park their savings in Fixed Deposits — trusting the bank, accepting … Debt Mutual Fund Complete Guide: Types, Returns, Risks, Tax — Everything in One PlaceRead more
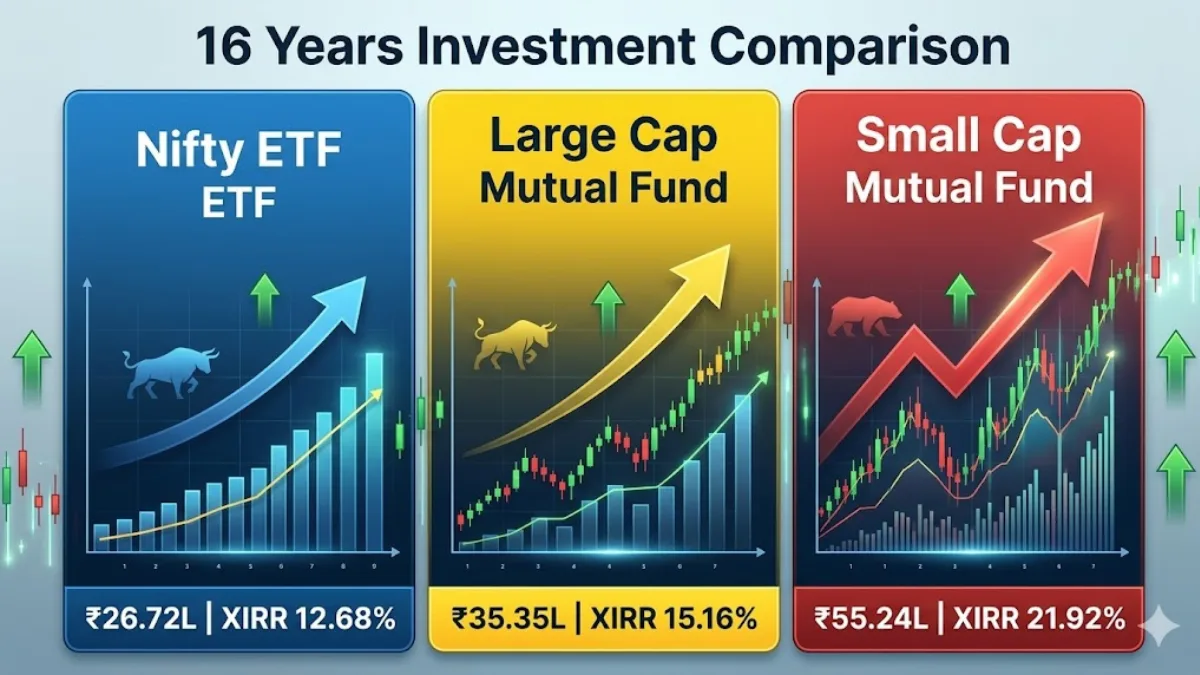
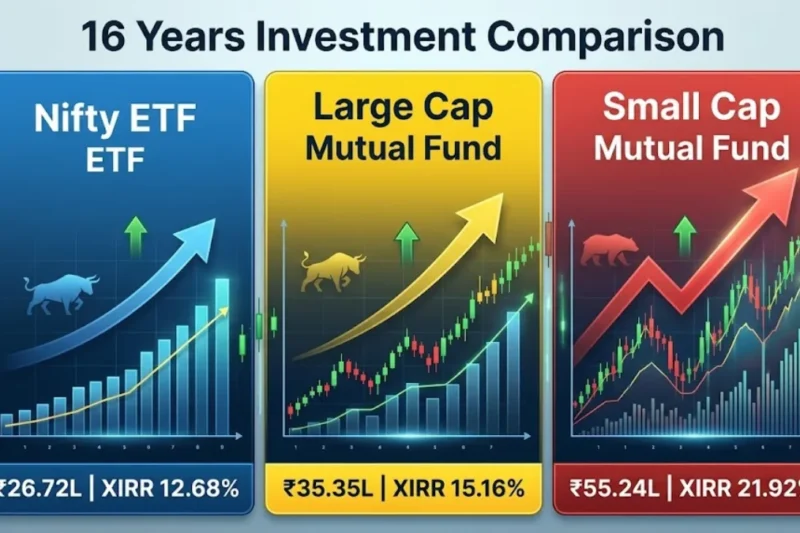
Most Indian investors spend 15–20 years saving every rupee — only to realize at the end … ETF vs Mutual Fund India: 16-Year Real SIP Data Shows Who Wins (Nifty ETF vs Large Cap vs Small Cap)Read more

Most Indians spend 40 years working hard — and still retire with just enough to survive, … Equity Mutual Funds India: Your Complete Roadmap from Zero to Financial FreedomRead more

Most people investing in mutual funds in India have never once asked themselves — why am … Best Mutual Funds for Beginners in India 2026: Stop Picking Randomly — Choose by Goal, Age & IncomeRead more

Imagine this: You invested ₹5 lakh in a mutual fund three years ago, and it has … Mutual Fund Taxation in India 2025-26: Complete Guide with Latest Rules & ExamplesRead more

You’ve saved ₹2 lakh. Your colleague swears by monthly SIPs, but your friend just made a … SIP vs Lumpsum: Which Investment Strategy is Right for You in 2026?Read more

The Nifty 50 index has been the benchmark of India’s stock market performance for over two … Nifty Historical Data (2000-2025): 11.27% CAGR Over 25 YearsRead more

The 2026 IPO market is witnessing participation from next-generation technology companies, especially in Artificial Intelligence and … Fractal Analytics IPO 2026 – Full Review, Dates, Price Band, Lot Size, Financials & AI Business AnalysisRead more

The Indian IPO market in 2026 continues to attract strong investor interest, especially in the NBFC … Aye Finance IPO 2026 – Complete Analysis, Dates, Price Band, Lot Size, Financials & Investor ViewRead more

Imagine this: You invest ₹50 lakh in 2010. The market crashes immediately. Then again. And again. … 3 Bucket SWP Strategy: ₹50L to ₹3Cr Despite 42% COVID Crash & 14 Market DownturnsRead more